Emerging Issues in Data Storytelling
CHAPTER 1 | The Challenges of Working With Incomplete Data Sets
The Challenges of working with incomplete data sets

Why Should I Care?
Making decisions using missing, inaccurate, or otherwise skewed data runs the risk of executing strategies or policies that are not reflective of your business challenge. For example: misinterpreting your customers when defining your marketing campaign objectives.
- Best case – you waste advertising spend.
- Worst case – you damage your brand’s relationship with customers.
Increasingly in a privacy-first world, we may need to engage data modelling techniques to ‘fill in the gaps’. We should also consider cross-checking models with other data sets, e.g., surveys (declared) vs. actual behaviour (observed).

What do we mean by incomplete datasets?
Incomplete data can be anything from a missing sequence, missing fields, missing files, poor data entry, etc. Generally, incomplete data is caused by specific issues:
Lack of Comprehensiveness
Where essential fields needed to support the required analysis are missing.
Lack of Consistency
Where the data collection methodology or sequence has changed during the required timeframe.
Lack of Accuracy
Where too many essential values are non-compatible or unexpected, e.g., the wrong format.
Lack of Validity or Integrity
Where missing data could prevent analysts from discerning important relationships or patterns.
Wrong or Misaligned Timeframe
Where the timeframe of data collection does not support the intended analysis.
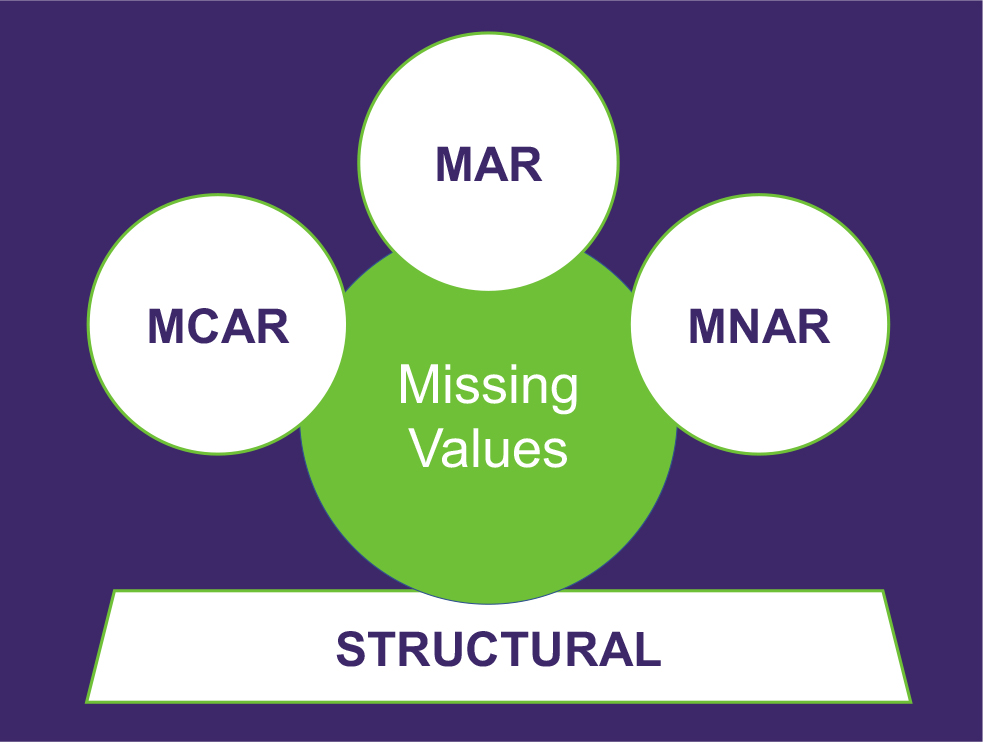
The 4 causes of missing data
Missing data occurs when no data value is stored for the variable in an observation.
- Missing Completely at Random (MCAR): Where the propensity for a missing data point DOES NOT have a relationship to any values in the data set, missing or declared. For example: a questionnaire that is lost in the post.
- Missing at Random (MAR): Where the propensity for a missing data point has no relationship to the missing data but IS related (conditional) to some of the declared data. For example: if men are more likely to tell you their weight than women.
- Missing NOT at Random (MNAR): Where the propensity for a missing data point DOES have a relationship to the missing values. For example: a survey where certain questions are predictably avoided (e.g., age, income).
- Structurally Missing: Where data is missing for an apparent reason – often the mechanism that caused the missing data is easily inferred. For example: when we transform data into tabular format – the process may fail or was poorly designed.
Building a meaningful narrative from incomplete data
You have three options to proceed with your analysis: removing data (partial deletion),
imputation (assignment of
missing values by inference), or keeping the missing values and using a model that incorporates them
(more limited).
In the first two cases (MCAR / MAR), it is safe to remove the data with missing values depending
upon their
occurrences, while in the third case (MNAR) removing observations with missing values can
produce a bias in the
analysis. We have to be careful before removing incomplete observations.
In situations where missing values are likely to occur, we need to be sure that any assumptions
will produce little
or no bias, therefore we can use ‘patterns’ to represent missing data – rather than (potentially
distorted) values.
Algorithms and/or Machine Learning (filling in with patterns) can help us with ‘full analysis’
of incomplete data.

The impact of legislation and regulation on data storytelling
De-identification, the process of anonymising user-level datasets, has become the main paradigm used in research and analysis to protect privacy – driven by modern data protection laws, such as the European GDPR (2018) and the US CCPA (2018).
This paradigm is now shifting again; global players in the digital ecosystem, like Apple and Google, are systematically denying access to any user-level data, In the case Apple: advising users of their right (and system functionality) to block data collection.
The process of de-identification can render datasets inaccurate (e.g., unique reach and frequency of advertising exposure). The latest industry developments of aggregation and/or depletion are rendering these datasets increasingly incomplete.
Inconsistent data = inconsistent insights. 76% of marketers* agreed that it was already difficult to assess how well their brand was performing across multiple channels. In the next few years, this percentage is likely to increase.
*Source: Kantar, Getting Media Right, 2019
The role of consumer data in data storytelling
Data storytelling bridges two worlds: the creative
and the formulaic; emotive communication and
hard data.
Instead of presenting a singular conclusion, data
storytelling methods should be about encouraging
a wider and more open conversation about what
the data insights are saying.
Different types of consumer data can contribute to
imputation and/or modelling of incomplete data to
enable ‘full analysis’.
Qualify declared data with behavioural data
Brands are looking to deep consumer insight to shape meaningful stories that resonate
with their audience. Data Storytelling has a strong synergy to Brand Storytelling.
Transformative behavioural data goes far beyond demographics – qualifying interests, attitudes, perceptions and motivations.
Qualify declared data with behavioural data
Predictive analytics can help the data storyteller shape a compelling narrative that goes beyond the ‘what happened’.
Listening to consumers will allow you to prioritise and identify new opportunities
(i.e., where to focus your predictive analysis).
Scalability – how to get beyond having data storytelling be just a one-off
“...by 2025... 75% of data stories will be automatically generated using augmented intelligence and machine learning rather than generated by data analysts.”
Source: James Richardson, Gartner
Automated data stories are pointing to automatically generated text – the same programmatic approach
that generates short newspaper stories, particularly for financial and sports summaries. There is nothing
wrong with a text summary that pulls trends and outliers from data. But is that a data story?
Good data stories aren't just about communicating numbers – they’re about empathetic audience engagement. Encouraging and teaching data storytelling needs more than the right visual or a well-crafted sentence.
The danger of scalability is that both imputation and (the craft of) storytelling occurs without human rationalisation (and/or support of more evidence).
In Summary:
Incomplete data sets are here to stay and will grow in complexity with the increasing pressure on data privacy. Missing data needs human rationalisation, which can be supported by cross-referencing different sources of consumer data – scalability is not simply automation of charts and text.
The future of data storytelling depends on:
Increased Data Literacy
User-Centric Tools and Training
Defined Methodology
Share your thoughts on LinkedIn
Join the next Data Storytelling Council discussion!
Uncover insights with the leading Data Marketing professionals, and experience the value of Council Meetings firsthand! Potential Members can participate in up to 2 trial Council Meetings. Register now to explore your topics of interest.